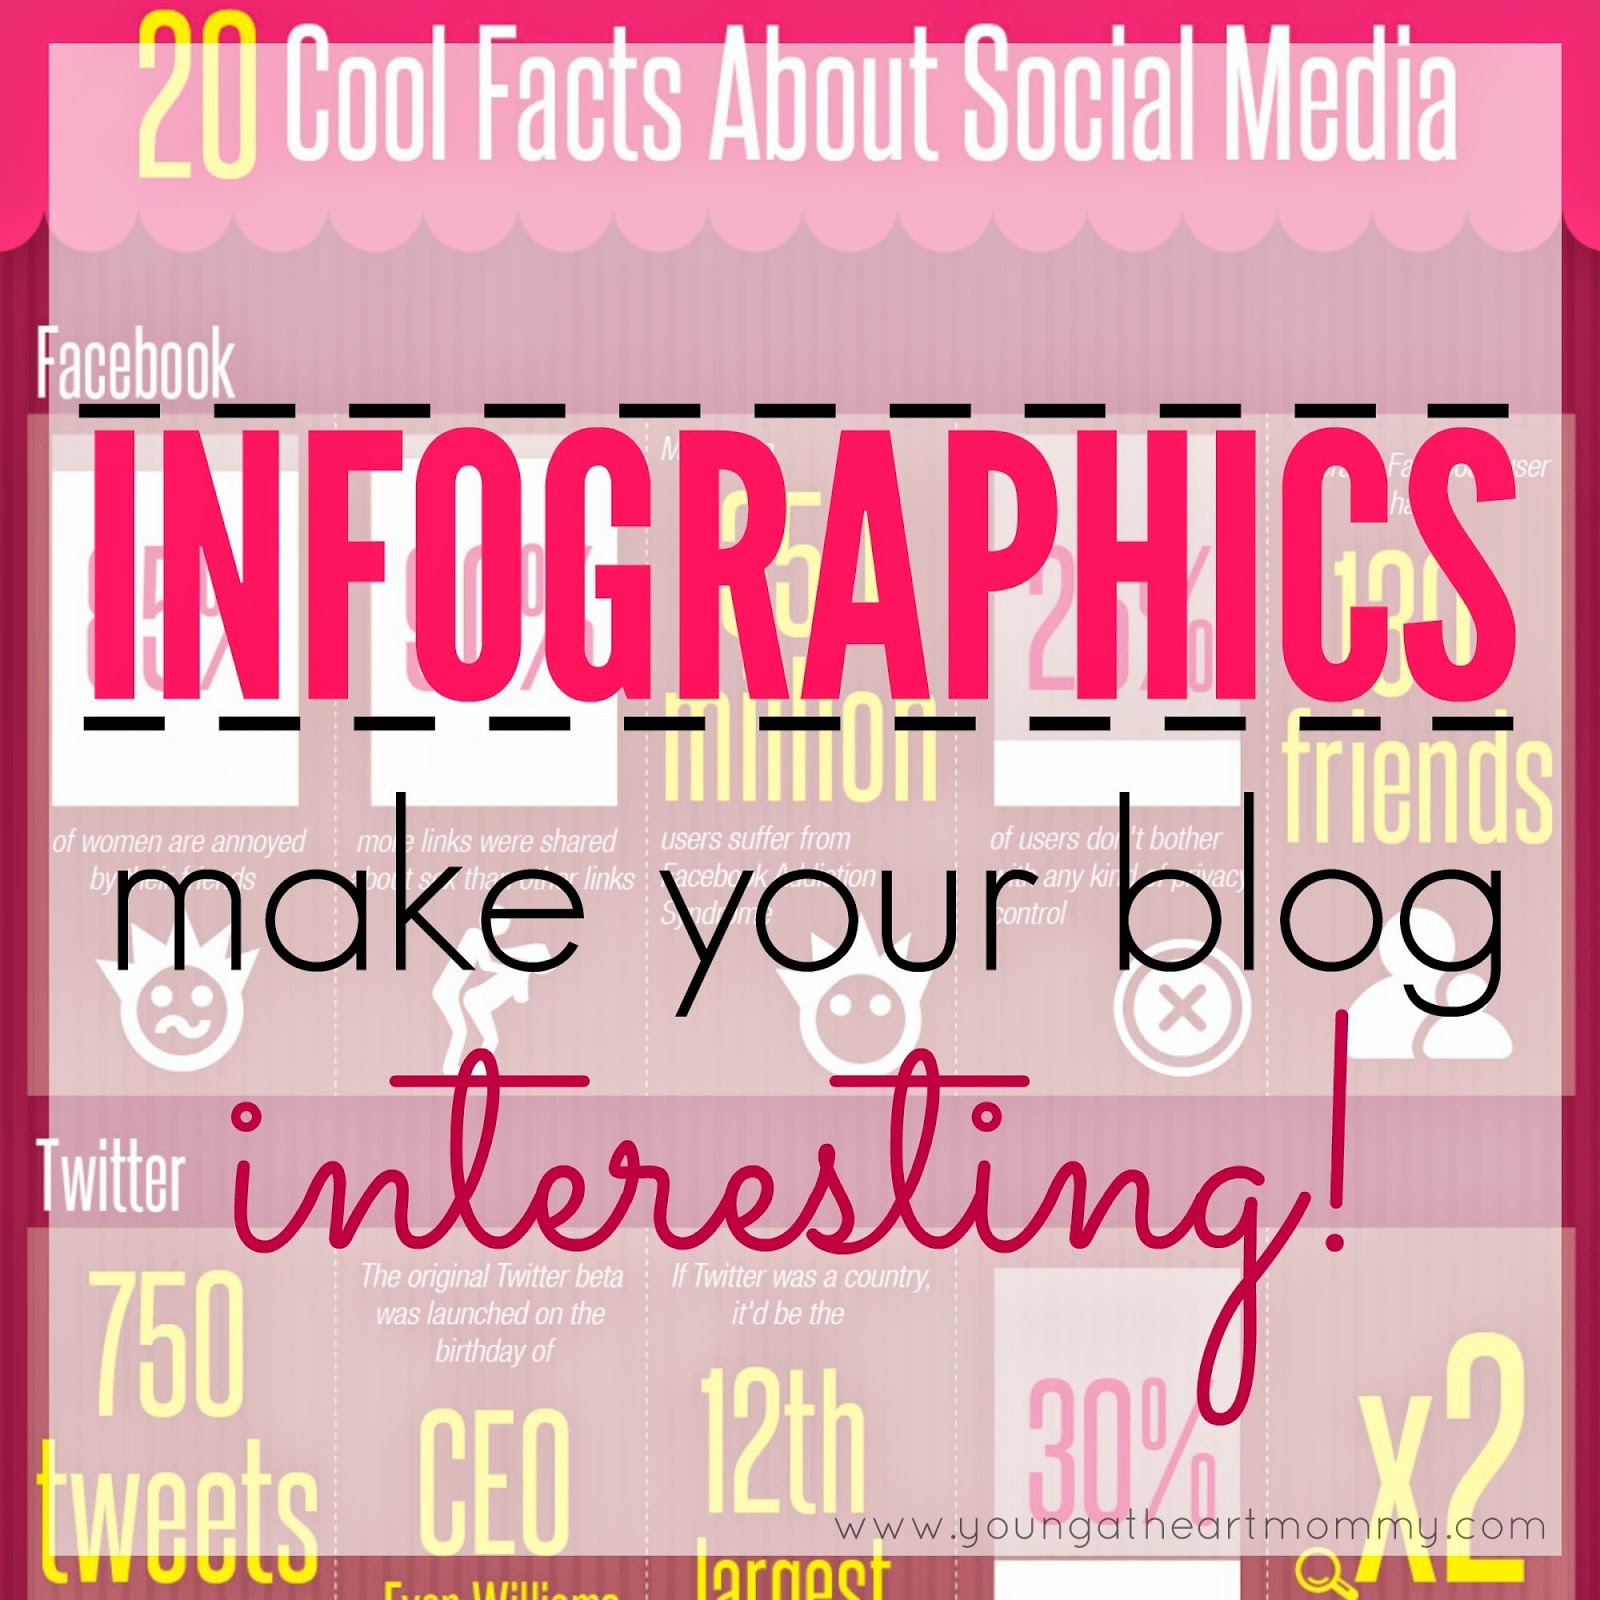
You read correct. I may be a noob but I discovered the “infographic” in its entirety today. I have always been aware of what an infographic is, even used it on my blog once or twice, but never actually utilized one to its full potential. In case you are in the same lonely boat as I am, an infographic is defined as a visual image such as a chart or diagram used to represent information. It contains eye catching elements while also delivering statistics or interesting facts in a poster like format. They look rather easy to create and design but are still chalk full of important info. They’re also fun to read and make for great conversation starters with friends, family, and your readers.
Try using Google to search your topic of choice followed by the word infographic. It could be anything from coffee to facial hair. You’d be really surprised at the plethora of topics they have these on. While doing my own browsing I came across the “Odd Facts About The Human Body.” I learned that stomach acid can actually dissolve a razor blade and the fastest growing nail is on your middle finger. See there, I bet I just shared some useless yet interesting information that you will probably go and tell at least one other person for the heck of it. At last… the power of the INFOGRAPHIC is upon us!
Other than the purpose of self entertainment and a good laugh, infographics can be used to bring more attention to your blog. How so? Readers are naturally drawn to photos, articles, and tidbits that interest them. While they may not read every single word of your post I can guarantee they will take a few extra minutes to look at your photos. An Infographic is worth a thousand words and it’s an easy way to learn about a topic without reading paragraph upon paragraph. They typically highlight the most valuable and most engaging points. Human beings are visual creatures. We are easily stimulated by images that appeal to us and process most information based on what we are viewing. They are also highly pinnable and spread like wildfire once discovered.
Next time you are preparing an impromptu blog post and need a little flare search for infographics that correspond with the information you are sharing with your readers. See if it makes a difference in your page views or general interaction. If it does then find a way to incorporate them into sponsored posts as well. Don’t be a boring blogger. Bring something fresh to the table and give your readers a reason to come back again.
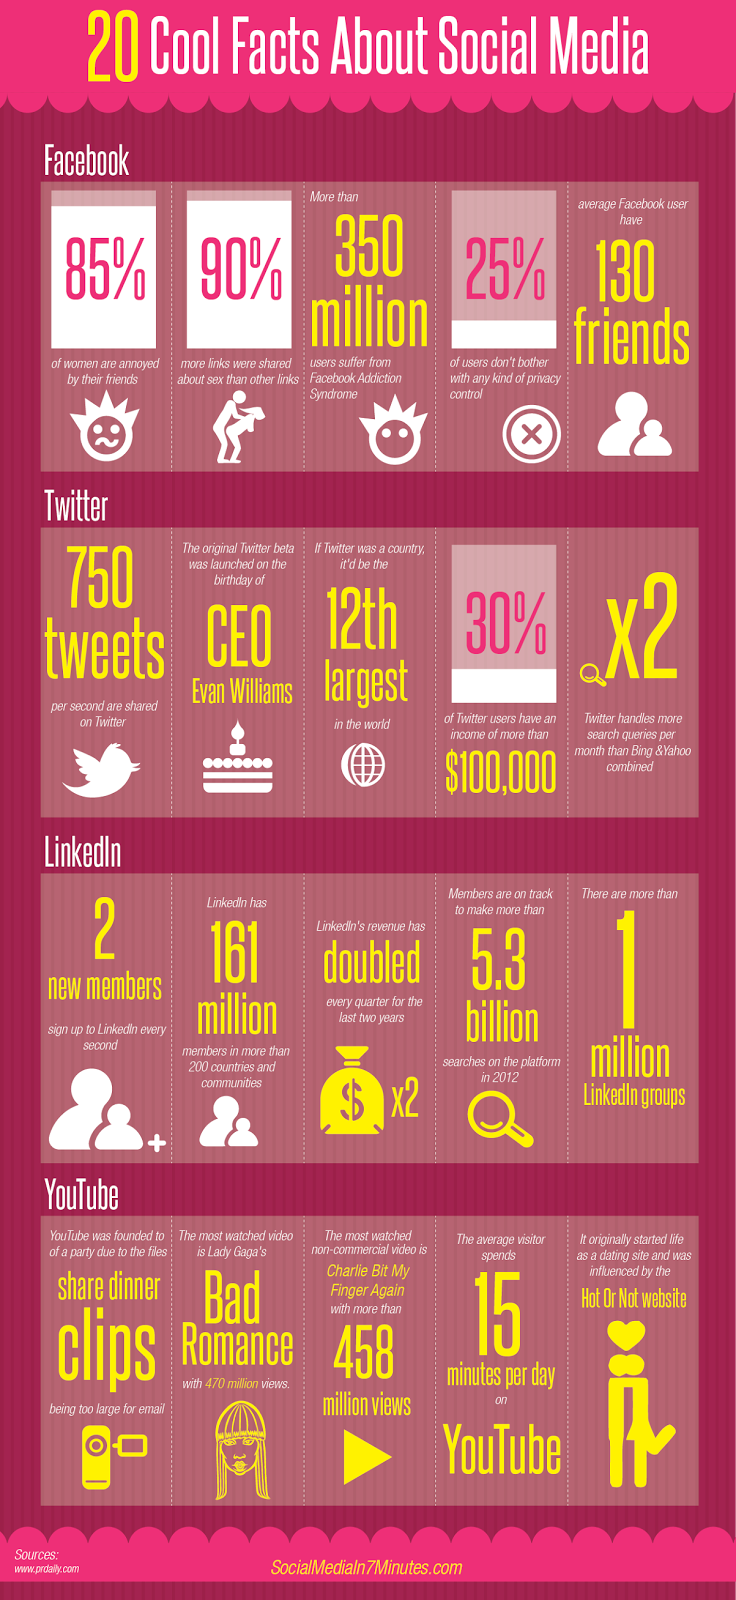
Since social media appears to be a part of all of our lives in one way or another I decided to share the “20 Cool Facts About Social Media.” You can see first hand how this stimulating image turns conventional data into a fun topic of interest.
Do you notice a difference in reader interaction when you use infographics within your posts?


Interesting, now I know what an infographics is.
I've never made one before, I'll have to give it a try sometime
I like infographs, we do not make enough of them.. they tell people a nice visual story.
I love infographics and keep telling myself I need to work on creating some.
What a really great infographic. I've just pinned it. I should try making one.
Great tips and the infographs were very well done!
I love infographics. I don't use them enough but I definitely know their value is amazing. Great post!
Yeah, I love that infographics have become so popular. I need to practice making them.
Now I'm going to have to watch that middle finger nail and see it's true for me!
this is a great post. Visual is everything. I totally agree with you.
Thanks! Me either. They really do make a huge difference in traffic though. People are usually drawn to the photos we post.
I love infographics. I like them so much that i had my media kit made into a infographic I think it makes it look more interesting.